14.6. Profiling with XdebugXdebug is just like APD an extension that is used to collect data while executing a script, though the philosophy behind this extension is different. Where APD mainly focuses on profiling, Xdebug also focuses on debugging of scripts, including breakpoints and stepping through code. Profiling with Xdebug can be accomplished in two ways:
cachegrind is a profiler for programs written in C, and comes with a very nice front-end for KDE: KCachegrind. 14.6.1. Installing XdebugJust like APD, you can install Xdebug (http://xdebug.org) from PECL by running pear install xdebug. After installation, you must load Xdebug into Zend and configure it properly for a task. An example configuration in php.ini to load Xdebug follows: zend_extension = "/usr/lib/php/extensions/20040412/xdebug.so"; or for threaded web servers (Apache on Windows, or IIS): zend_extension_ts = "c:/php5/extensions/xdebug.dll"; The configuration of Xdebug depends on which goal you want to accomplish. 14.6.2. Tracing Script ExecutionTracing function calls during the execution of a script gives you the option to examine which function is called in order, including optional parameters and return values. Not only are the function calls written to the trace file, but the trace also contains timing information and memory usage. Optimal configuration settings for making execution traces are shown in Table 14.2.
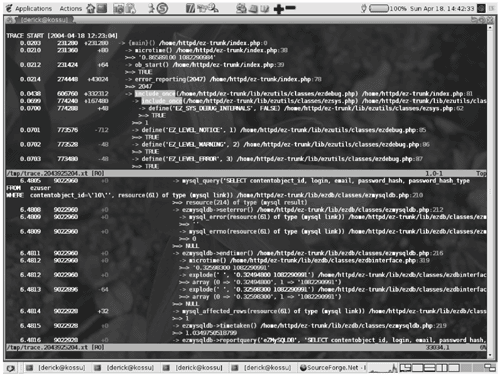
Tip All settings, except xdebug.extended_info, can also be set in .htaccess files; these settings enable you to control which scripts should generated trace files on a per-directory base. Note Traces can grow large (greater than 100MB) with complex scripts, especially when those last two options are turned on. Make sure you have enough disk space in your dump directory. When all the settings are made and a script is requested through a browser (or command line), Xdebug generates a trace file in the configured dump directory with the name TRace.<crc32 of the current working directory>.xtfor example, TRace.480204079.xt. Figure 14.9 shows a trace file. Figure 14.9. A trace file. Each line starts with a time index since the beginning of the script, then the amount of memory in use, the difference between the current memory usage, and the previous line. The indentation shows the relation between the function calls followed by the function name and its parameters. The last items on a line are the file name and line number from where the function was called. In the upper half of the figure, you can clearly see that besides include_once taking some time, including a file also adds a lot to the memory footprint. Although you can optimized the loading time with an opcode cache, not including the file is the only way to reduce memory usage. It might be worthwhile to look into if you really need all the include files in your script, or perhaps it might be a good idea to split up one big include file into multiple small ones that can be more selectively included in your scripts. 14.6.3. Using KCachegrindAlthough a trace can be useful for simple profiling, it is meant more as a debugging tool to figure out what happens during the execution of a script. Xdebug also features a pure profiler function, which requires the settings shown in Table 14.3, in addition to the ones specified in Table 14.2, to provide the best results.
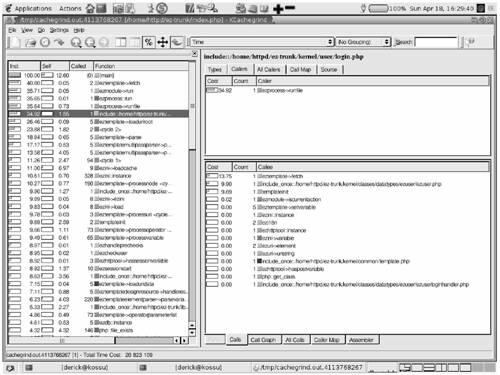
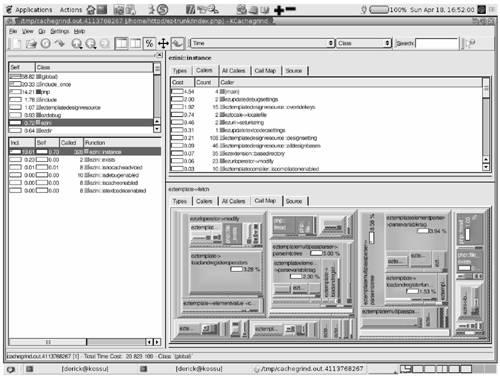
These settings can also be placed inside .htaccess files to be more flexible in controlling which scripts will be generating profile information. As stated previously, the generated profile data can be analyzed with the KCachegrind (http://kcachegrind.sourceforge.net/cgi-bin/show.cgi/KcacheGrindIndex) program, which runs only with KDE (or KDE libraries installed). Start KCachegrind and locate the generated profiler data file, which has the format cachegrind.out.<number>; this is the format that KCachegrind filters on by default. After loading the trace file, KCachegrind shows something similar to what appears in Figure 14.10. Figure 14.10. The result of loading the trace file in KCachegrind. The left pane shows all functions in the script, sorted by time spent in that function, including any called functions. The one at the top is always the pseudo function {main}. When selecting a function (include::/home/httpd/ez-trunk/kernel/user/login.php), all functions from which this "function" was called appear in the upper-right pane. In this case, the function was called only once, from ezprocess->runfile. All functions that were called from the include.... login.php function appear in the lower-right pane. The numbers beneath Cost define how much percent was spent in this called function. These numbers will never add up to 100 percent because the function from which they were called requires some time to execute. The reason why Xdebug generates a function named include::/home/httpd/ez-trunk/kernel/user/login and not simply include with a parameter is because all includes would have been grouped together, thus losing some of the information. By adding the file name to the function name, all includes of the same file will still be grouped, but the different include files will not (see Figure 14.11). Figure 14.11. Grouped files. KCachegrind supports grouping functions in the left pane by class name (or source file). On the right side, we switched to the Call Map tab. This diagram shows the time spend in functions called from the on the left selected function (eztemplate->fetch()). The larger the area is, the more time was spent in that function. The diagram isn't limited to function calls directly from the selected function, but also functions called from the called-functions, and so on. Moving the mouse pointer over an area shows you the stack of functions to the one over which your mouse is located, including the percentage of time that was spend in this function, relative to the selected one in the left pane. KCachegrind provides you with some more diagrams to give you an insight of your scripts, but discussing all those exceeds the scope of this chapter. The KCachegrind web site (http://kcachegrind.sourceforge.net/cgi-bin/show.cgi/KcacheGrindShot) offers an overview of all supported diagrams, including an extensive explanation. Although they talk about profiling C applications in the explanations, they are also applicable to Xdebug's profiler files. |


